Class LayeredBarRenderer
java.lang.Object
org.jfree.chart.renderer.AbstractRenderer
org.jfree.chart.renderer.category.AbstractCategoryItemRenderer
org.jfree.chart.renderer.category.BarRenderer
org.jfree.chart.renderer.category.LayeredBarRenderer
- All Implemented Interfaces:
Serializable,Cloneable,LegendItemSource,CategoryItemRenderer,PublicCloneable
A
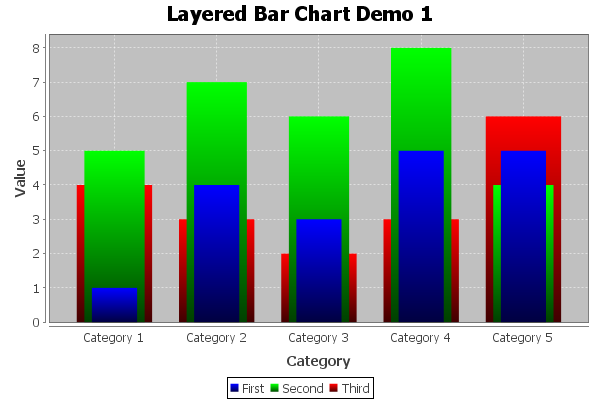
CategoryItemRenderer that represents data using bars which are
superimposed. The example shown here is generated by the
LayeredBarChartDemo1.java program included in the JFreeChart
Demo Collection:
- See Also:
-
Field Summary
FieldsFields inherited from class org.jfree.chart.renderer.category.BarRenderer
BAR_OUTLINE_WIDTH_THRESHOLD, DEFAULT_ITEM_MARGINFields inherited from class org.jfree.chart.renderer.AbstractRenderer
DEFAULT_ITEM_LABEL_INSETS, DEFAULT_OUTLINE_PAINT, DEFAULT_OUTLINE_STROKE, DEFAULT_PAINT, DEFAULT_SHAPE, DEFAULT_STROKE, DEFAULT_VALUE_LABEL_FONT, DEFAULT_VALUE_LABEL_PAINT, ZERO -
Constructor Summary
Constructors -
Method Summary
Modifier and TypeMethodDescriptionprotected voidcalculateBarWidth(CategoryPlot plot, Rectangle2D dataArea, int rendererIndex, CategoryItemRendererState state) Calculates the bar width and stores it in the renderer state.protected voiddrawHorizontalItem(Graphics2D g2, CategoryItemRendererState state, Rectangle2D dataArea, CategoryPlot plot, CategoryAxis domainAxis, ValueAxis rangeAxis, CategoryDataset dataset, int row, int column) Draws the bar for a single (series, category) data item.voiddrawItem(Graphics2D g2, CategoryItemRendererState state, Rectangle2D dataArea, CategoryPlot plot, CategoryAxis domainAxis, ValueAxis rangeAxis, CategoryDataset data, int row, int column, int pass) Draws the bar for one item in the dataset.protected voiddrawVerticalItem(Graphics2D g2, CategoryItemRendererState state, Rectangle2D dataArea, CategoryPlot plot, CategoryAxis domainAxis, ValueAxis rangeAxis, CategoryDataset dataset, int row, int column) Draws the bar for a single (series, category) data item.doublegetSeriesBarWidth(int series) Returns the bar width for a series, orDouble.NaNif no width has been set.voidsetSeriesBarWidth(int series, double width) Sets the width of the bars of a series.Methods inherited from class org.jfree.chart.renderer.category.BarRenderer
calculateBarL0L1, calculateBarW0, calculateSeriesWidth, drawItemLabel, equals, findRangeBounds, getBarPainter, getBase, getDefaultBarPainter, getDefaultShadowsVisible, getGradientPaintTransformer, getIncludeBaseInRange, getItemMargin, getLegendItem, getLowerClip, getMaximumBarWidth, getMinimumBarLength, getNegativeItemLabelPositionFallback, getPositiveItemLabelPositionFallback, getShadowPaint, getShadowsVisible, getShadowXOffset, getShadowYOffset, getUpperClip, initialise, isDrawBarOutline, setBarPainter, setBase, setDefaultBarPainter, setDefaultShadowsVisible, setDrawBarOutline, setGradientPaintTransformer, setIncludeBaseInRange, setItemMargin, setMaximumBarWidth, setMinimumBarLength, setNegativeItemLabelPositionFallback, setPositiveItemLabelPositionFallback, setShadowPaint, setShadowVisible, setShadowXOffset, setShadowYOffsetMethods inherited from class org.jfree.chart.renderer.category.AbstractCategoryItemRenderer
addEntity, addItemEntity, beginElementGroup, calculateDomainMarkerTextAnchorPoint, calculateRangeMarkerTextAnchorPoint, clone, createState, drawBackground, drawDomainGridline, drawDomainMarker, drawItemLabel, drawOutline, drawRangeLine, drawRangeMarker, findRangeBounds, getColumnCount, getDefaultItemLabelGenerator, getDefaultItemURLGenerator, getDefaultToolTipGenerator, getDomainAxis, getDrawingSupplier, getItemLabelGenerator, getItemMiddle, getItemURLGenerator, getLegendItemLabelGenerator, getLegendItems, getLegendItemToolTipGenerator, getLegendItemURLGenerator, getPassCount, getPlot, getRangeAxis, getRowCount, getSeriesItemLabelGenerator, getSeriesItemURLGenerator, getSeriesToolTipGenerator, getToolTipGenerator, hashCode, setDefaultItemLabelGenerator, setDefaultItemLabelGenerator, setDefaultItemURLGenerator, setDefaultItemURLGenerator, setDefaultToolTipGenerator, setDefaultToolTipGenerator, setLegendItemLabelGenerator, setLegendItemToolTipGenerator, setLegendItemURLGenerator, setPlot, setSeriesItemLabelGenerator, setSeriesItemLabelGenerator, setSeriesItemURLGenerator, setSeriesItemURLGenerator, setSeriesToolTipGenerator, setSeriesToolTipGenerator, updateCrosshairValuesMethods inherited from class org.jfree.chart.renderer.AbstractRenderer
addChangeListener, beginElementGroup, calculateLabelAnchorPoint, clearSeriesPaints, clearSeriesStrokes, endElementGroup, fireChangeEvent, getAutoPopulateSeriesFillPaint, getAutoPopulateSeriesOutlinePaint, getAutoPopulateSeriesOutlineStroke, getAutoPopulateSeriesPaint, getAutoPopulateSeriesShape, getAutoPopulateSeriesStroke, getDataBoundsIncludesVisibleSeriesOnly, getDefaultCreateEntities, getDefaultEntityRadius, getDefaultFillPaint, getDefaultItemLabelFont, getDefaultItemLabelPaint, getDefaultItemLabelsVisible, getDefaultLegendShape, getDefaultLegendTextFont, getDefaultLegendTextPaint, getDefaultNegativeItemLabelPosition, getDefaultOutlinePaint, getDefaultOutlineStroke, getDefaultPaint, getDefaultPositiveItemLabelPosition, getDefaultSeriesVisible, getDefaultSeriesVisibleInLegend, getDefaultShape, getDefaultStroke, getItemCreateEntity, getItemFillPaint, getItemLabelAnchorOffset, getItemLabelFont, getItemLabelInsets, getItemLabelPaint, getItemOutlinePaint, getItemOutlineStroke, getItemPaint, getItemShape, getItemStroke, getItemVisible, getLegendShape, getLegendTextFont, getLegendTextPaint, getNegativeItemLabelPosition, getPositiveItemLabelPosition, getSeriesCreateEntities, getSeriesFillPaint, getSeriesItemLabelFont, getSeriesItemLabelPaint, getSeriesNegativeItemLabelPosition, getSeriesOutlinePaint, getSeriesOutlineStroke, getSeriesPaint, getSeriesPositiveItemLabelPosition, getSeriesShape, getSeriesStroke, getSeriesVisible, getSeriesVisibleInLegend, getTreatLegendShapeAsLine, hasListener, isComputeItemLabelContrastColor, isItemLabelVisible, isSeriesItemLabelsVisible, isSeriesVisible, isSeriesVisibleInLegend, lookupLegendShape, lookupLegendTextFont, lookupLegendTextPaint, lookupSeriesFillPaint, lookupSeriesOutlinePaint, lookupSeriesOutlineStroke, lookupSeriesPaint, lookupSeriesShape, lookupSeriesStroke, notifyListeners, removeChangeListener, setAutoPopulateSeriesFillPaint, setAutoPopulateSeriesOutlinePaint, setAutoPopulateSeriesOutlineStroke, setAutoPopulateSeriesPaint, setAutoPopulateSeriesShape, setAutoPopulateSeriesStroke, setComputeItemLabelContrastColor, setDataBoundsIncludesVisibleSeriesOnly, setDefaultCreateEntities, setDefaultCreateEntities, setDefaultEntityRadius, setDefaultFillPaint, setDefaultFillPaint, setDefaultItemLabelFont, setDefaultItemLabelFont, setDefaultItemLabelPaint, setDefaultItemLabelPaint, setDefaultItemLabelsVisible, setDefaultItemLabelsVisible, setDefaultLegendShape, setDefaultLegendTextFont, setDefaultLegendTextPaint, setDefaultNegativeItemLabelPosition, setDefaultNegativeItemLabelPosition, setDefaultOutlinePaint, setDefaultOutlinePaint, setDefaultOutlineStroke, setDefaultOutlineStroke, setDefaultPaint, setDefaultPaint, setDefaultPositiveItemLabelPosition, setDefaultPositiveItemLabelPosition, setDefaultSeriesVisible, setDefaultSeriesVisible, setDefaultSeriesVisibleInLegend, setDefaultSeriesVisibleInLegend, setDefaultShape, setDefaultShape, setDefaultStroke, setDefaultStroke, setItemLabelAnchorOffset, setItemLabelInsets, setLegendShape, setLegendTextFont, setLegendTextPaint, setSeriesCreateEntities, setSeriesCreateEntities, setSeriesFillPaint, setSeriesFillPaint, setSeriesItemLabelFont, setSeriesItemLabelFont, setSeriesItemLabelPaint, setSeriesItemLabelPaint, setSeriesItemLabelsVisible, setSeriesItemLabelsVisible, setSeriesItemLabelsVisible, setSeriesNegativeItemLabelPosition, setSeriesNegativeItemLabelPosition, setSeriesOutlinePaint, setSeriesOutlinePaint, setSeriesOutlineStroke, setSeriesOutlineStroke, setSeriesPaint, setSeriesPaint, setSeriesPositiveItemLabelPosition, setSeriesPositiveItemLabelPosition, setSeriesShape, setSeriesShape, setSeriesStroke, setSeriesStroke, setSeriesVisible, setSeriesVisible, setSeriesVisibleInLegend, setSeriesVisibleInLegend, setTreatLegendShapeAsLineMethods inherited from class java.lang.Object
finalize, getClass, notify, notifyAll, toString, wait, wait, waitMethods inherited from interface org.jfree.chart.renderer.category.CategoryItemRenderer
addChangeListener, getDefaultCreateEntities, getDefaultFillPaint, getDefaultItemLabelFont, getDefaultItemLabelPaint, getDefaultItemLabelsVisible, getDefaultNegativeItemLabelPosition, getDefaultOutlinePaint, getDefaultOutlineStroke, getDefaultPaint, getDefaultPositiveItemLabelPosition, getDefaultSeriesVisible, getDefaultSeriesVisibleInLegend, getDefaultShape, getDefaultStroke, getItemCreateEntity, getItemFillPaint, getItemLabelFont, getItemLabelPaint, getItemOutlinePaint, getItemOutlineStroke, getItemPaint, getItemShape, getItemStroke, getItemVisible, getNegativeItemLabelPosition, getPositiveItemLabelPosition, getSeriesCreateEntities, getSeriesFillPaint, getSeriesItemLabelFont, getSeriesItemLabelPaint, getSeriesNegativeItemLabelPosition, getSeriesOutlinePaint, getSeriesOutlineStroke, getSeriesPaint, getSeriesPositiveItemLabelPosition, getSeriesShape, getSeriesStroke, getSeriesVisible, getSeriesVisibleInLegend, isItemLabelVisible, isSeriesItemLabelsVisible, isSeriesVisible, isSeriesVisibleInLegend, removeChangeListener, setDefaultCreateEntities, setDefaultCreateEntities, setDefaultFillPaint, setDefaultItemLabelFont, setDefaultItemLabelFont, setDefaultItemLabelPaint, setDefaultItemLabelPaint, setDefaultItemLabelsVisible, setDefaultItemLabelsVisible, setDefaultNegativeItemLabelPosition, setDefaultNegativeItemLabelPosition, setDefaultOutlinePaint, setDefaultOutlinePaint, setDefaultOutlineStroke, setDefaultOutlineStroke, setDefaultPaint, setDefaultPaint, setDefaultPositiveItemLabelPosition, setDefaultPositiveItemLabelPosition, setDefaultSeriesVisible, setDefaultSeriesVisible, setDefaultSeriesVisibleInLegend, setDefaultSeriesVisibleInLegend, setDefaultShape, setDefaultShape, setDefaultStroke, setDefaultStroke, setSeriesCreateEntities, setSeriesCreateEntities, setSeriesFillPaint, setSeriesItemLabelFont, setSeriesItemLabelFont, setSeriesItemLabelPaint, setSeriesItemLabelPaint, setSeriesItemLabelsVisible, setSeriesItemLabelsVisible, setSeriesItemLabelsVisible, setSeriesNegativeItemLabelPosition, setSeriesNegativeItemLabelPosition, setSeriesOutlinePaint, setSeriesOutlinePaint, setSeriesOutlineStroke, setSeriesOutlineStroke, setSeriesPaint, setSeriesPaint, setSeriesPositiveItemLabelPosition, setSeriesPositiveItemLabelPosition, setSeriesShape, setSeriesShape, setSeriesStroke, setSeriesStroke, setSeriesVisible, setSeriesVisible, setSeriesVisibleInLegend, setSeriesVisibleInLegendMethods inherited from interface org.jfree.chart.util.PublicCloneable
clone
-
Field Details
-
seriesBarWidthList
A list of the width of each series bar.
-
-
Constructor Details
-
LayeredBarRenderer
public LayeredBarRenderer()Default constructor.
-
-
Method Details
-
getSeriesBarWidth
Returns the bar width for a series, orDouble.NaNif no width has been set.- Parameters:
series- the series index (zero based).- Returns:
- The width for the series (1.0=100%, it is the maximum).
-
setSeriesBarWidth
Sets the width of the bars of a series.- Parameters:
series- the series index (zero based).width- the width of the series bar in percentage (1.0=100%, it is the maximum).
-
calculateBarWidth
protected void calculateBarWidth(CategoryPlot plot, Rectangle2D dataArea, int rendererIndex, CategoryItemRendererState state) Calculates the bar width and stores it in the renderer state.- Overrides:
calculateBarWidthin classBarRenderer- Parameters:
plot- the plot.dataArea- the data area.rendererIndex- the renderer index.state- the renderer state.
-
drawItem
public void drawItem(Graphics2D g2, CategoryItemRendererState state, Rectangle2D dataArea, CategoryPlot plot, CategoryAxis domainAxis, ValueAxis rangeAxis, CategoryDataset data, int row, int column, int pass) Draws the bar for one item in the dataset.- Specified by:
drawItemin interfaceCategoryItemRenderer- Overrides:
drawItemin classBarRenderer- Parameters:
g2- the graphics device.state- the renderer state.dataArea- the plot area.plot- the plot.domainAxis- the domain (category) axis.rangeAxis- the range (value) axis.data- the data.row- the row index (zero-based).column- the column index (zero-based).pass- the pass index.
-
drawHorizontalItem
protected void drawHorizontalItem(Graphics2D g2, CategoryItemRendererState state, Rectangle2D dataArea, CategoryPlot plot, CategoryAxis domainAxis, ValueAxis rangeAxis, CategoryDataset dataset, int row, int column) Draws the bar for a single (series, category) data item.- Parameters:
g2- the graphics device.state- the renderer state.dataArea- the data area.plot- the plot.domainAxis- the domain axis.rangeAxis- the range axis.dataset- the dataset.row- the row index (zero-based).column- the column index (zero-based).
-
drawVerticalItem
protected void drawVerticalItem(Graphics2D g2, CategoryItemRendererState state, Rectangle2D dataArea, CategoryPlot plot, CategoryAxis domainAxis, ValueAxis rangeAxis, CategoryDataset dataset, int row, int column) Draws the bar for a single (series, category) data item.- Parameters:
g2- the graphics device.state- the renderer state.dataArea- the data area.plot- the plot.domainAxis- the domain axis.rangeAxis- the range axis.dataset- the dataset.row- the row index (zero-based).column- the column index (zero-based).
-